Detailed Analysis of Covid-19 Data.
Generating facts and insights on the World’s Covid-19 situation through Exploratory Data Analysis.


Everyone declared it a pandemic. The world evolution of the severe acute respiratory syndrome coronavirus 2 (SARS- COV2 or simply COVID-19). The evolution of this virus is one of the most dangerous problems for society. It spreads widely in China and large numbers of people became infected. It wreaked great havoc to the health and safety of people all over the world due to its high spreading power. At present, it’s been under control in some areas while the new coronavirus is spreading rapidly in other areas.
Most research agencies immediately assessed available data to learn what care approaches are most effective and for analyzing the growth and spread rate all across the globe, to know which countries are doing better and which are doing worse.
Without data, we cannot understand the pandemic. Only based on good data can we know how the virus is spreading, what impact the pandemic has on the lives of people around the world, and whether countermeasures countries are taking are successful or not. This is quite not different from all the data we’ve been seeing. They’re all far from perfect. But with just the little visualization and detailed explanation of what we will learn from this data: we should be able to generate some useful insights at the end.
Here is the visualization to explore the statistics on the coronavirus pandemic for every countries in the world .
Data Source
Provided by the She Code Africa cohort 2 programs. Each metrics can be seen in a straight forward CSV file that aligns the countries and their respective continents. It shows different data features like Country, Total Cases, New Cases, New Deaths, Total Deaths, Total Recovered, Active Cases, Serious/Critical, Continents.
Data Cleaning
An exploratory data analysis has been done to understand the number of different cases reported. Cleaning is required the fill the empty and missing values which could occur because of non-response when no information is provided for one or more items. The Barplot and Countplot from Matplotlib and Seaborn were used for visualizing the numerical and categorical variables.
Check out the code on GitHub.
Let’s dive thoroughly into it…
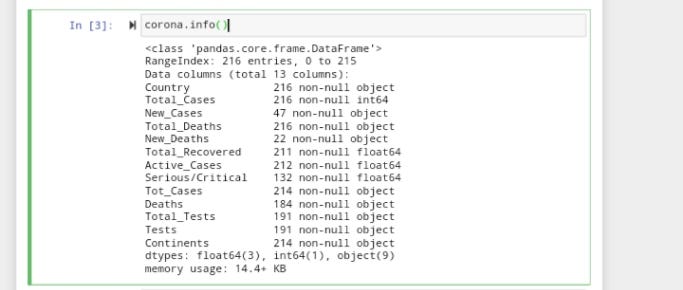
The function corona.info() was used for generating knowledge on the whole data frame.
Note: corona is the name of the data frame encompassing all the data features.

Continents

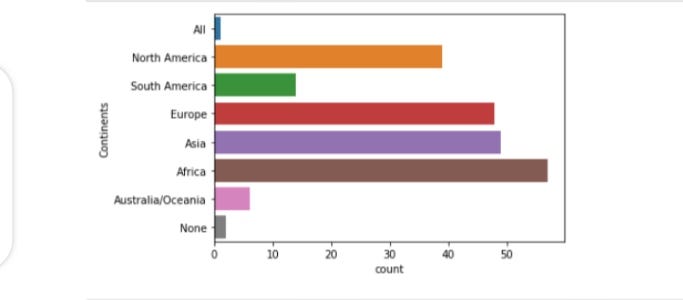
The Africa continent has the highest number of countries. Her countries are widely infected by the virus. Asia, Europe, North America continents are very much affected likewise.
- 57 out of the 58 countries in Africa are infected. Saint Helena which is a dependency or territory of the U.K. is uninfected.
- 49 out of the 51 countries and territories in Asia are infected. There are no confirmed cases in North Korea. The North Korean government alleged to have successfully prevented Covid-19 from spilling into its border. The Turkmen government claims that there are no cases in Turkmenistan, but they didn’t let the WHO officials into the country-- for some strange reasons.
- All 48 countries in Europe are infected with the virus.
- All 14 countries in South America are infected.
- 6 of the 16 Australia/Oceania continents are infected. 10 Oceanian countries have yet to report a case: Micronesia, Kiribati, Marshall Island, Palau, Vanuatu, Solomon Island, Samoa, Tuvalu, Tonga, Nauru.
Total Cases

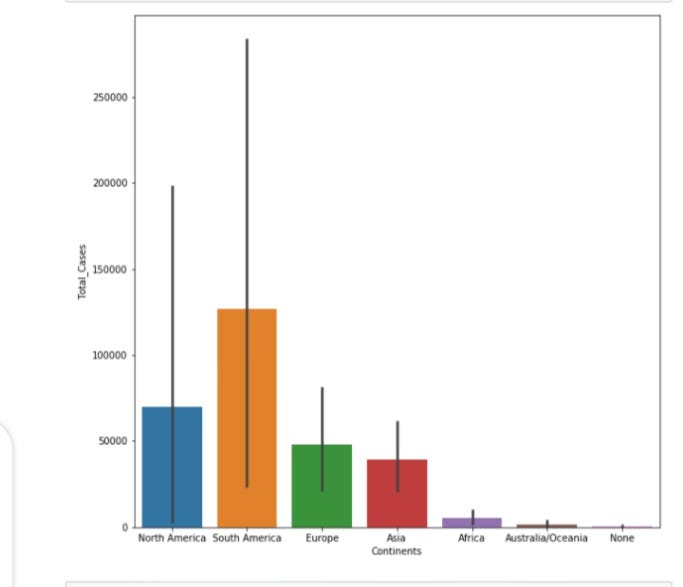
South America has the highest number of Cases of about 1,377,869 cases out of the 422.5 million population.
Note: The whole of America has a total case of 4,821,920.
Serious/Critical

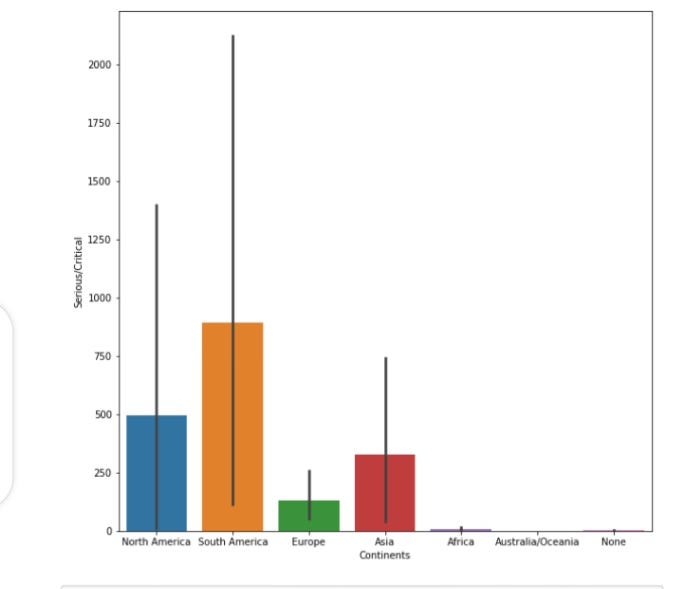
South America Covid-19 cases appeared to be very serious and critical, followed by North America among the whole continents.
Total Recovered

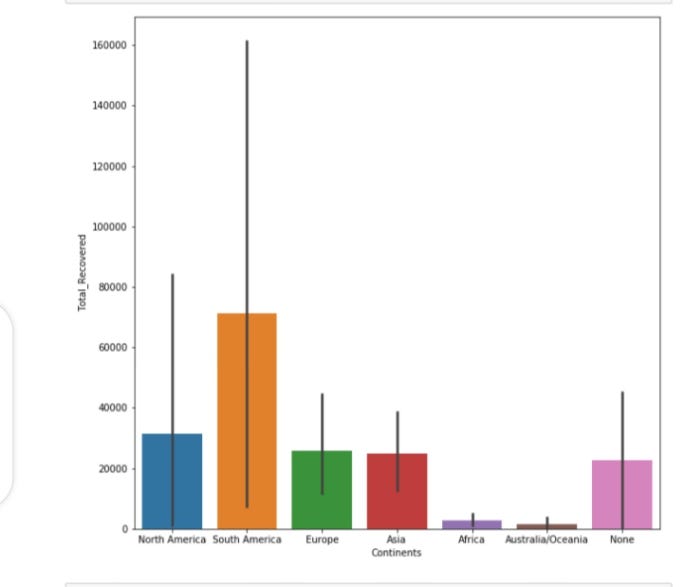
Due to the dearth of testing and medical facilities. It’s believed that South America has the highest recovery rate of about 70,000.
Total Deaths

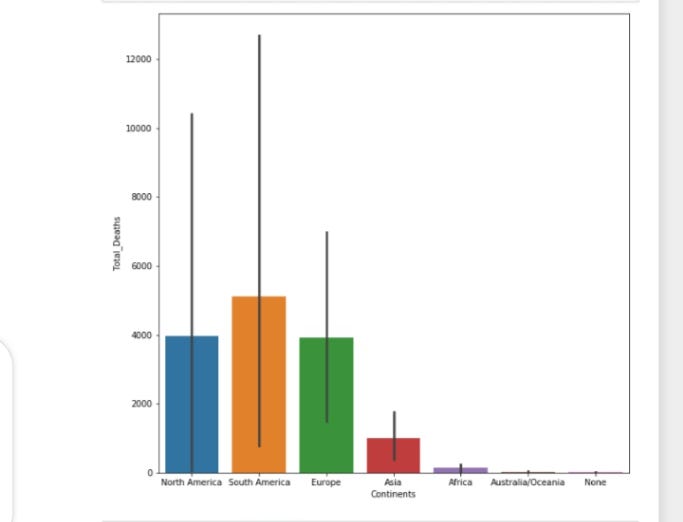
There’s quite a raise in the South America distribution, followed by North America and to Europe.
Tests

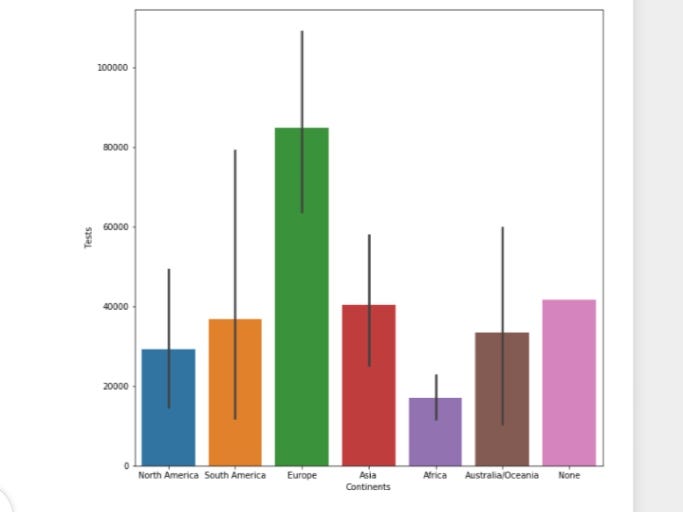
From this distribution, It indicates that the European continent did the highest Covid-19 tests on her citizens. We can also deduce that;

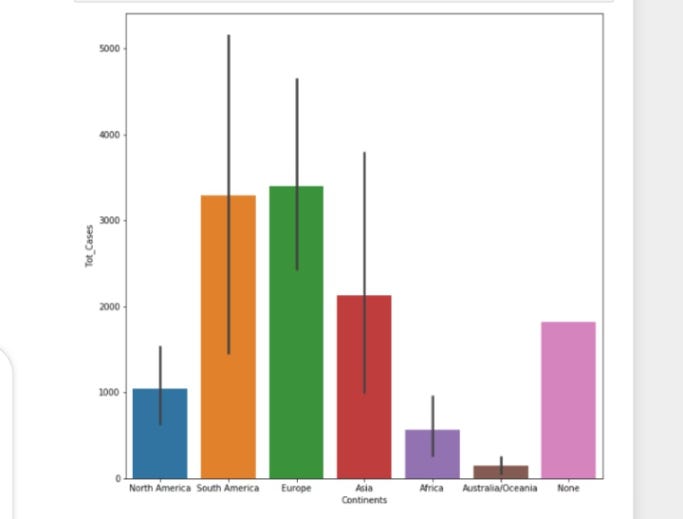

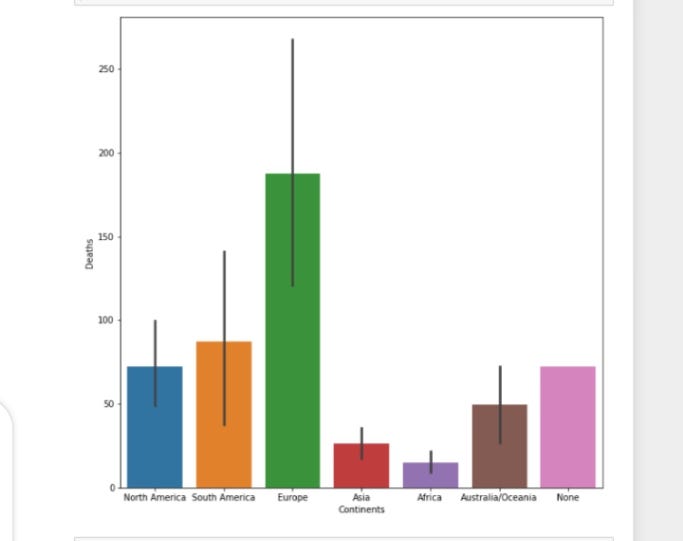
The higher the number of tests carried out in a continent, the higher the number of confirmed cases and deaths. Europe carried out the highest test in each country with about 2,365, 834 confirmed cases, 189,812 deaths.
Negative Cases

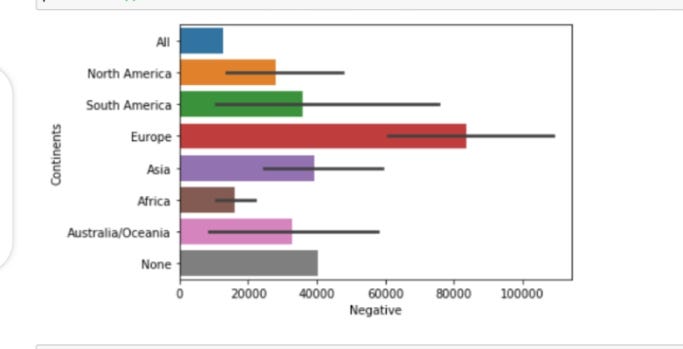
This data column was derived by subtracting the Test column from the New Cases column. Due to the validity that Europe carried out the highest test on people, there’s a very high likelihood of her, testing more people who haven’t been in contact with the deadly virus.
Basic insights induced from this visualization.
- 181 out of the 194 countries in the world are infected with severe acute respiratory syndrome while most of the uninfected countries are from Australia and Oceania continent.
- The South America continent is seen to have the highest case so far.
- The continent with the lowest number of cases is Australia/ Oceania. Many of the countries here are seen to not have recorded any covid19 case.
- Europe seems to be the continent with the best medical facilities. This increases the rate at which cases are being monitored and tests being carried out.
Check out the code on GitHub.
G. I Focus: Healthcare / HiTech. Robotics/IoT/AI.
#SGC Undergrad Vortex.
#She Code Africa.
